Tools.
Dashboards, diagnostics, frameworks, and downloads that help your school close the gap between looking at data and changing what happens in the classroom. Browse freely.
How we think about thisDashboards.
Desktop dashboards that turn your school's data into something specific enough to act on. Every dashboard runs 100% offline. Your students' data never leaves your computer.
NAPLAN Dashboard
AvailableAvailable now. Part of every EIP school subscription.
NAPLAN Dashboard
AvailableAvailable now. Part of every EIP school subscription.
A desktop application that turns your VCAA CSV data into an interactive analysis environment. Built for school-level NAPLAN analysis, with guided interpretation and observation prompts that walk your team from the numbers to the next move.
What it does
Cohort Overview
Year-level summaries and growth analysis that point to where to focus this term.
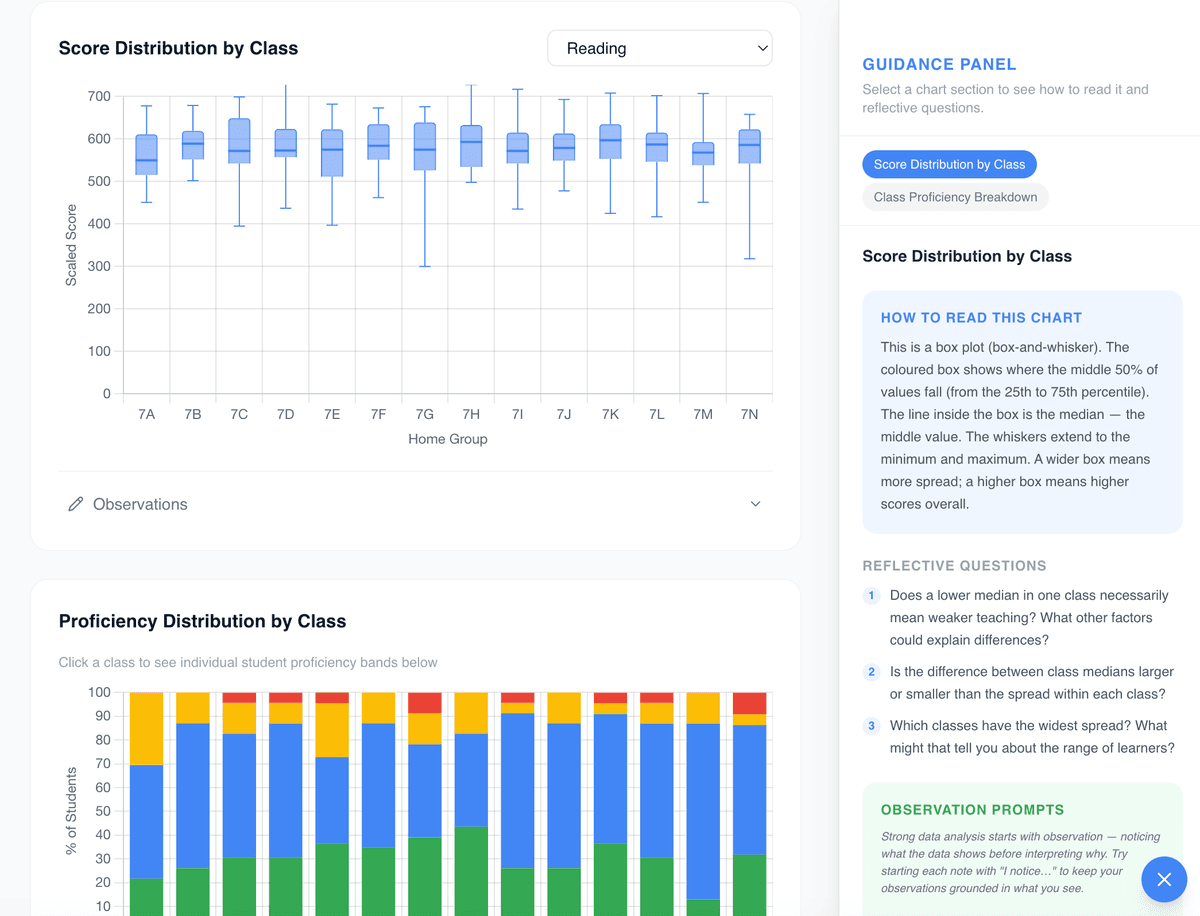
Class Comparison
See how your classes compare, with prompts that help you explore differences without finger-pointing.
Item Analysis
Subdomain heatmaps and item-level insights that show what to reteach and for whom.
Growth Tracking
Year-on-year analysis of cohort and individual growth, with vulnerability alerts for students who've stalled.
Observation Prompts
Every chart comes with reflection questions designed for data meetings. You don't just see the data. You know what to ask about it.
Fully Offline
Runs entirely on your computer. Your students' data is never uploaded, stored, or sent anywhere.
A minute inside the dashboard
A minute inside the NAPLAN dashboard
A walkthrough of what a data meeting looks like with the dashboard on screen. We start with a cohort overview, land on a specific pattern, read the observation prompts, and end with a decision for Monday.
Built-in learning supports
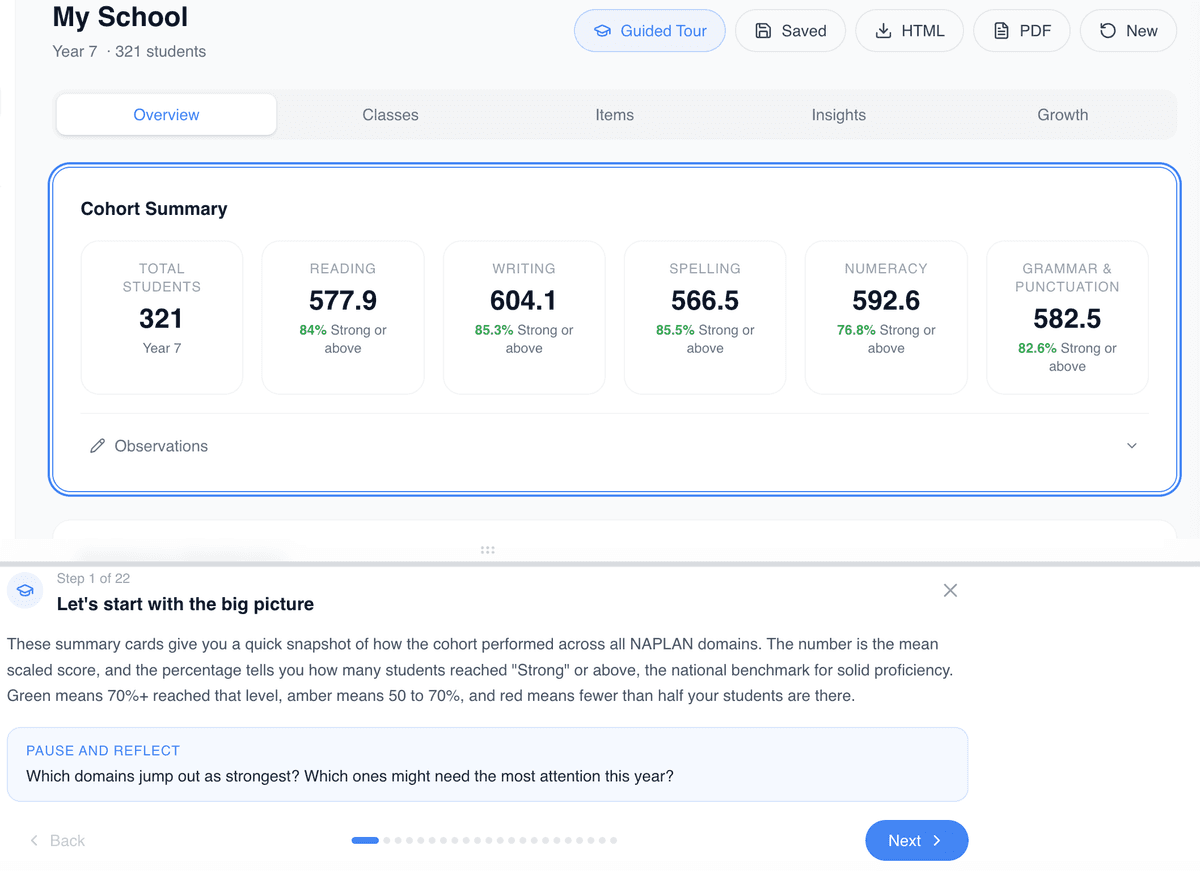
Guided walkthroughs
Step-by-step explanations of each view
Card explainers
Key concepts broken down in plain language
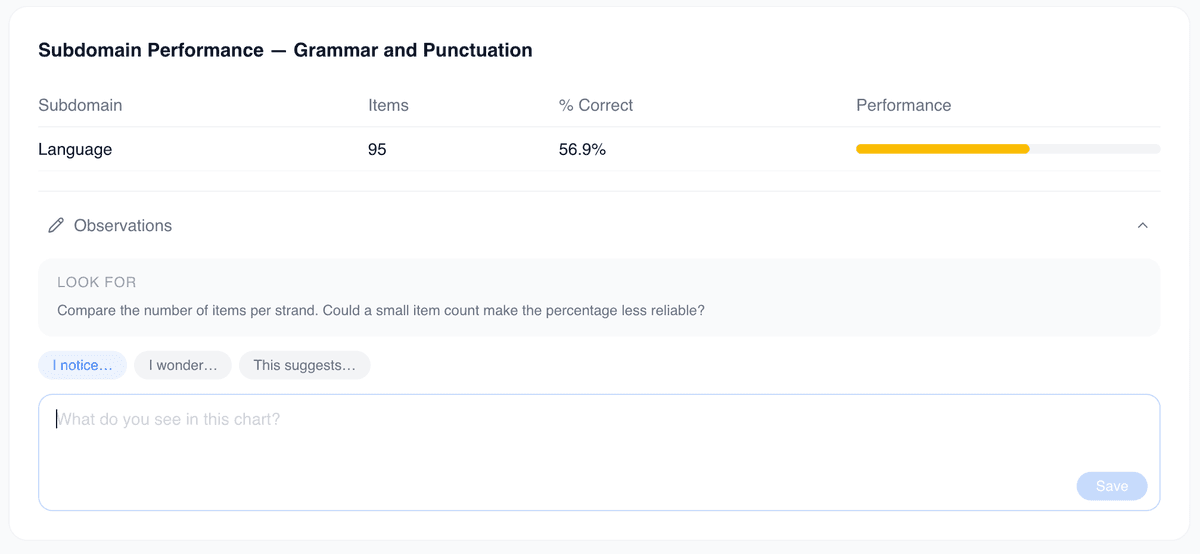
Observation scaffolds
Reflective prompts for data conversations
VCE Dashboard
Coming soonComing soon. Bundled with secondary and K-12 subscriptions.
VCE Dashboard
Coming soonComing soon. Bundled with secondary and K-12 subscriptions.
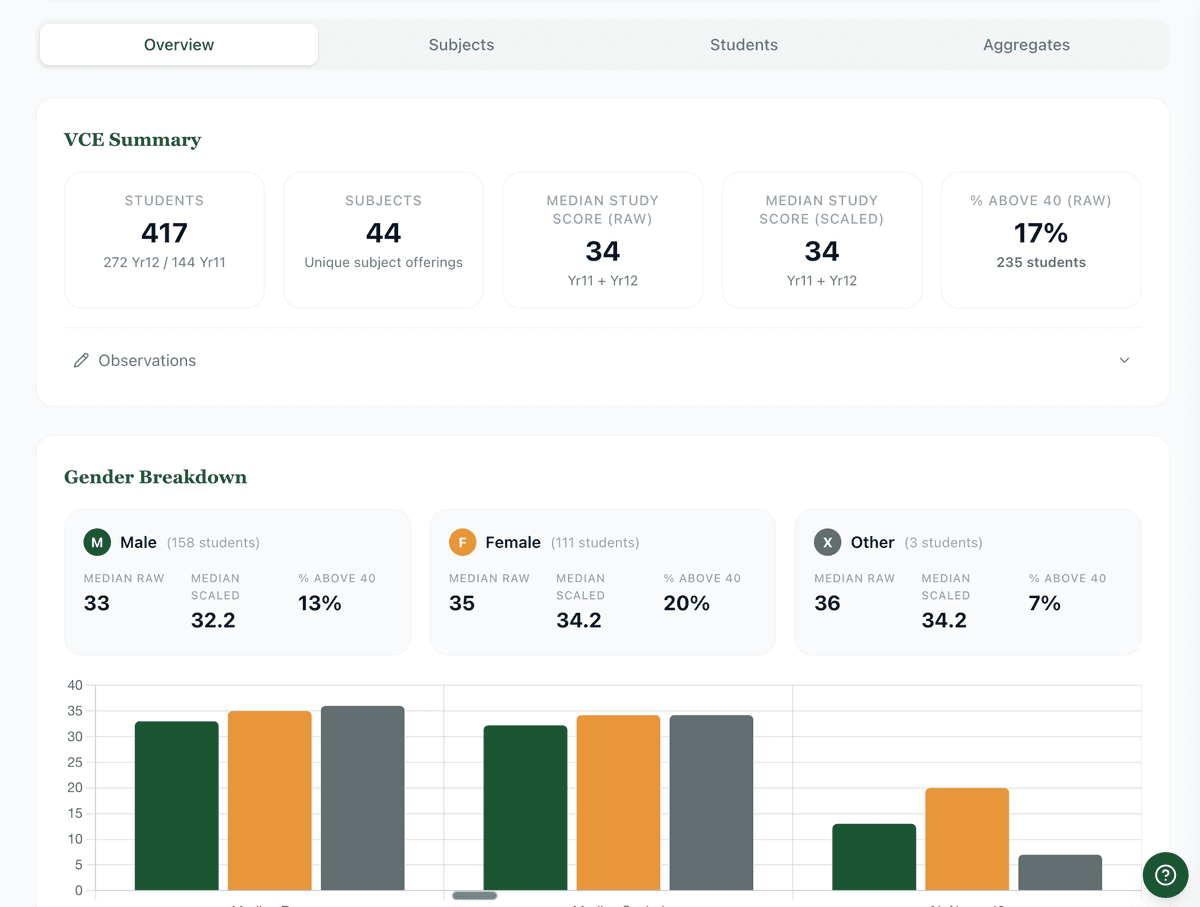
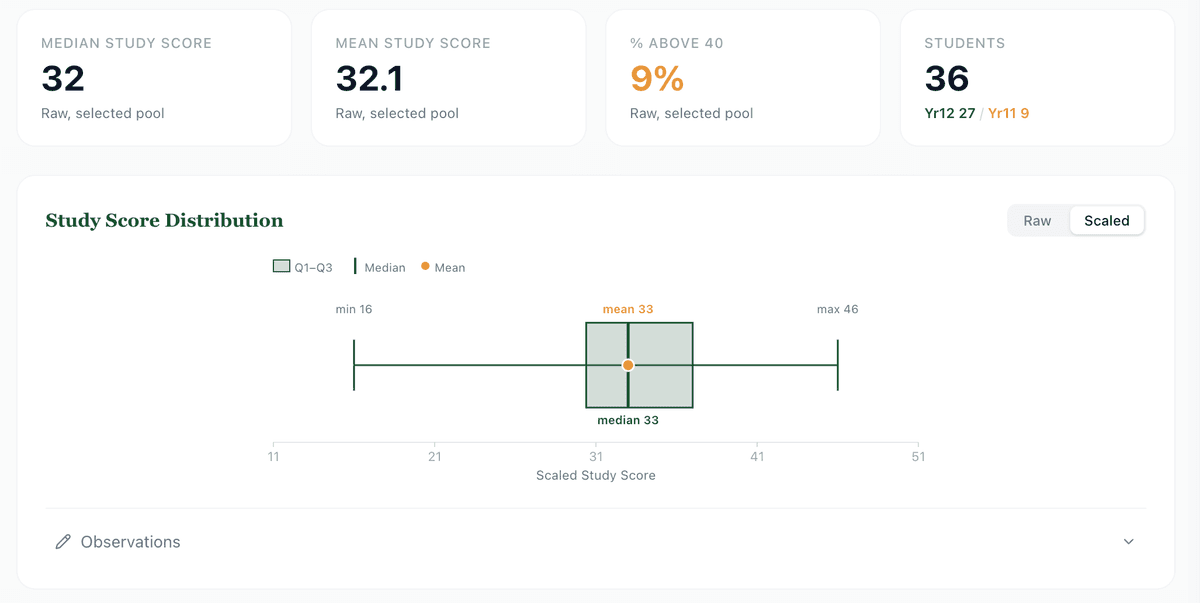
Built for faculty review conversations about senior secondary VCE results. Analyse study scores, GA performance, and value-added data in one place, with approximate scaled score calculations that let you compare raw and scaled performance across cohorts, studies, and students. Guided interpretation and observation scaffolds help your team move from the numbers to decisions about teaching.
What it does
Study Score Distribution
See the shape of your results across every study, with cohort comparisons and cohort-level summary stats.
GA Performance
GA1, GA2, and GA3 performance analysis with consistency checks that show where a student's pattern is telling you something.
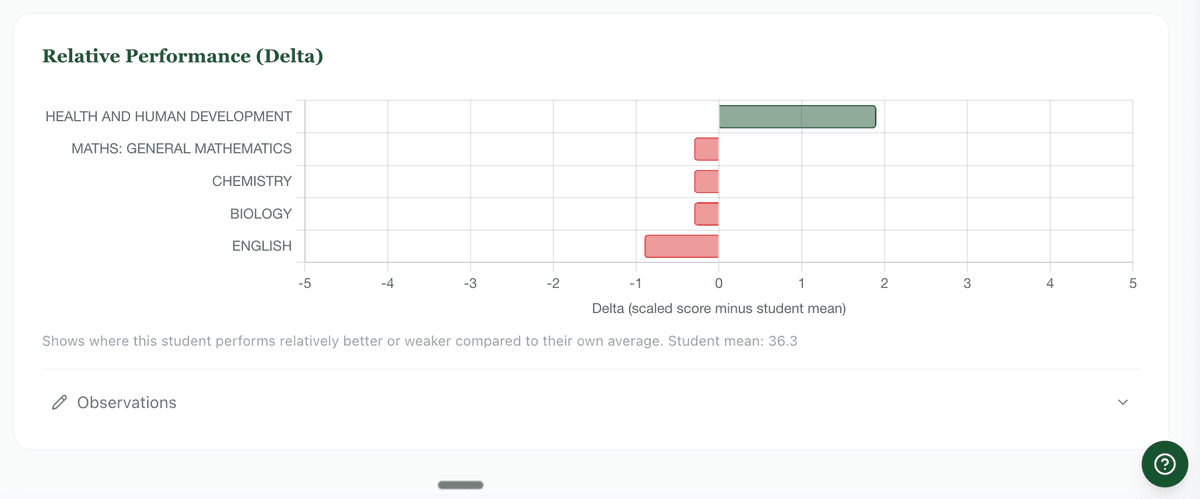
Value-Added Analysis
How each study's results compared to expected performance, with faculty-level views and flags for investigation.
Raw and Scaled Scores
Approximate scaled score calculations so you can view raw scores and scaled scores side by side across cohorts, studies, and students, and compare like with like.
Faculty Review Scaffolds
Reflection prompts and conversation protocols built for end-of-year faculty review meetings, not just reading charts.
Fully Offline
Runs entirely on your computer. Your students' data is never uploaded, stored, or sent anywhere.
A minute inside the dashboard
A minute inside the VCE dashboard
Walk through how faculty review conversations change when study scores, GA performance, and value-added data are in one place, with prompts that push the conversation toward specific curriculum and teaching decisions.
Built-in learning supports
Cohort overview
Top-level results across every study, at a glance
Subject overview
Per-study analysis for faculty review
Student-level detail
Individual performance in context of the cohort
PAT Dashboard
Coming soonComing soon. Bundled with primary and K-12 subscriptions.
PAT Dashboard
Coming soonComing soon. Bundled with primary and K-12 subscriptions.
Class comparisons, growth trajectories, and item-level insights for PAT testing. Built to plug straight into the same analysis rhythm as the NAPLAN dashboard, with prompts for planning targeted intervention.
What it does
Class Comparison
Class-by-class performance with prompts that keep the conversation focused on instruction, not ranking.
Growth Trajectories
Individual and cohort growth over time, with alerts for students whose trajectory has flattened.
Item-Level Insights
Question-level analysis that shows which skills a class is ready for and which need another pass.
Intervention Planning
Scaffolds that help your team move from a performance gap to a specific intervention decision.
Observation Prompts
Reflection questions designed for data meetings, consistent with the NAPLAN dashboard's approach.
Fully Offline
Runs entirely on your computer. Your students' data is never uploaded, stored, or sent anywhere.
A minute inside the dashboard
A minute inside the PAT dashboard
Walk through how a year-level team turns PAT results into a specific intervention plan, using the dashboard's built-in prompts to move from data to decision.
Diagnostics.
Free pulse check surveys that help you understand where your team is at and what to focus on next. You'll learn just by taking them. Take either one as a taster of how EIP thinks about data work, or as a structured starting point for your next PL day.
Collective Data Literacy Pulse Check
A quick diagnostic that maps your team's confidence across six data literacy competencies: accessing, valuing, interpreting, making decisions, communicating, and ethical management. Useful for naming which parts of the cycle your team is ready to close and which parts still need capability building.
- ~10 minutes per person
- 29 questions, 6 dimensions
- Instant visual results on screen
Best for: teams wanting to see where their collective data literacy is strongest and weakest before planning PL.
Start the pulse checkData Culture Pulse Check
A role-based diagnostic that surfaces how your school's current data culture is supporting or blocking the cycle. Choose your role (teacher, middle leader, or principal) and get a personalised profile with targeted recommendations.
- ~5 minutes
- 21 questions, 3 pillars
- Role-specific feedback
Best for: leadership teams wanting an honest read on where their whole-school data culture is leaking. Compare principal and teacher responses for a particularly revealing picture.
Start the pulse checkFrameworks and protocols.
Guides, protocols, and meeting structures that stop actions going vague and stop the loop going unclosed.
Setting Data Norms
A practical guide for establishing how your team talks about, shares, and acts on data together.
Coming SoonLeadership for Inquiry
A framework for school leaders building cultures of inquiry and evidence-informed decision making.
Coming SoonDownloads.
Printable resources for your staff room, your desk, or your next PL session.
Data Literacy Framework
A 6-dimension framework covering how educators value, interpret, communicate, access, make decisions with, and ethically manage data. Includes reflection prompts for self-assessment.
Download PDFCulture Toolkits
Activity packs for professional learning sessions on building a productive data culture.
Coming SoonWant to see how these tools work together?
Every tool on this page is designed to plug a specific leak in your school's data cycle. Our approach page walks through the full picture.